
A session on developing Indicator 11.7.1 of the Sustainable Development Goals shows that remote sensing is powerful, but must be supplemented by field assessments — and public involvement

I am pleased to offer a report on this remarkable side event of the July HLPF in New York. The objective of this session was to assess the current status of and next steps required for measuring the quantity, quality and equitable spatial distribution of public space. This event sought to advance the implementation of SDG 11.7 which states: “by 2030, provide universal access to safe, inclusive and accessible, green and public spaces, particularly for women and children, older persons and persons with disabilities.” The indicator 11.7.1 specifically focuses on gathering data on the “average share of the built-up area of cities that is open space for public use for all, by sex, age and persons with disabilities.”
The specific objectives of the session were to:
- Introduce and advocate for the importance of gathering the data for target 11.7.1.
- Converge towards a methodology for gathering comparable data on public space (Quantity, quality, distribution, age and sex disaggregated, and other factors TBD).
- Define the next steps in engaging local and national governments in gathering this data to monitor implementation of the SDG 11.7 but also to inform city-wide public space strategies.
The speakers were:
Didier Vancutsem, Secretary-General, ISOCARP (Moderator); Jon Kher Kaw, Senior Urban Development Specialist, World Bank; Alice Siragusa, Project Officer, European Commission, Directorate General Joint Research Centre; Cecilia Andersson, Urban Planning and Design Branch, UN-Habitat; Ayanda Roji, Department of Parks and Zoo, City of Johannesburg; and the author, Michael Mehaffy, Senior Researcher and Project Leader, KTH Centre for the Future of Places
Didier Vancutsem began by welcoming attendees and introducing the panel. He reiterated the objectives of the session and commented on the wider context of public space and its importance, and the importance of Goal 11.7 in particular.
Jon Kher Kaw of the World Bank presented their work to develop an indicator for public space and livability factors using remote sensing data and other datasets. He presented their pilot study of Dhaka, Bangladesh, which has many challenges for livability. They gather data of three kinds — very high resolution, high resolution, and other data sets. They then overlay layers, confirming assets on the ground. Their system is capable of object-based image recognition for such features as marketplaces, parks etc. They will be able to use the GiSAT-1 satellite data and other sources. Their system uses a rule-based analysis, taking data and combining with rules, e.g. if the target site is next to a road, adjacent to water, etc. This gives a remarkably detailed mapping of the overall distribution of public spaces, and also patterns of changes over time. They can also perform a connectivity analysis for streets and paths. They are able to identify proxy indicators such as road connectivity, open green space, amenities. Jon concludes that remote sensing doesn’t mean you don’t also do on-the-ground analysis and “ground-truthing,” but a lot can be done with just the remote sensing. They start with the neighborhood level. They are able to prioritize assets and spaces for upgrading, then develop detailed design concepts and so on. With this data they can work on multiple systems at the same time, e.g. drainage systems, greenery, pathways, etc. Using multiple layers gives a stronger picture. Also they are able to use analyses to identify proxy “unseen” systems, e.g. infrastructure or lack of it (e.g. no irrigation, etc). They can also combine big data sources from bicycle riders, cell phones and so on to determine usage patterns. These do pose privacy issues, but they are optimistic that they can be managed.
The audience asked a few questions, including clarifying whether they measured the average distance to public space – they do. They do not measure health impacts directly but of course they are indirect results of better-quality public spaces.
Alice Siragusa of the European Commission, Joint Research Centre, spoke of their mission to support EU policies with independent evidence. They use indicators and analysis to identify trends, policy changes needed. They also do territorial modeling. Their focus is Europe although they have gotten involved in non-European projects as part of European assistance projects – for example, the LUISA Territorial Modelling Platform for Africa. They are able to analyze patterns of change in five-year timesteps, including population, land use, and so on. Base maps are generated, but then complications can arise because of discrepancies between satellite and official data on specific land use classes. They typically use Copernicus high-resolution land cover maps as input data, as well as national official statistics, censuses and surveys. She discussed a test case of theirs in Accra, Ghana.
Regarding the 11.7.1 indicator, they propose to measure how many residents can reach green areas of a minimum size within a minimum walking distance. They are also looking at a minimum size of .25 hectare, inside the urban area, that intersects with a street or pedestrian path. They can do this as an automated analysis, including a network analysis, density of street intersections, accessibility. The results can be displayed in an easily understood graphic. Still, the remote sensing cannot entirely replace ground-truthing but can provided data on a large number of cities, ensuring the comparability of the information
Cecilia Andersson of UN-Habitat presented their current work on developing an indicator. She explained that they do knowledge management, tool development, technical cooperation, pilot projects and other implementation actions. She noted that we have to know where we are in order to know where to go. It will be important to know the quality, quantity and distribution of public spaces. So the assessment tool needs to be able to do this, as the first step: assessment, then strategy, action plan, design principles, pilot projects, monitoring and evaluation. It is also important to have a city-wide public space assessment. We need to know the share of land dedicated to public space, what is the ownership, who has control and so on. So they are working on a toolbox – allowing us to know where we are. Public spaces are also not just green spaces, but crucially, streets and public facilities. We need to know about quantity per person, typical access, distribution, and other aspects.

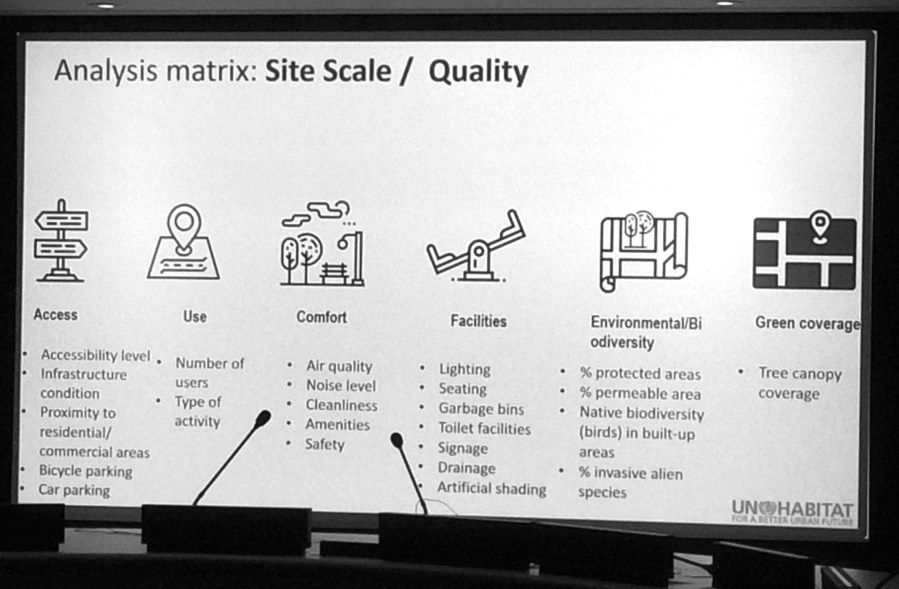
Key tasks include gathering data, doing the “data cleansing,” and report writing. At the site scale, we need to know accessibility, use, comfort, facilities, environmental and biodiversity, and green coverage. At the city scale, we need to know spatial accessibility, quantity, location and distribution, environmental and biodiversity, and network characteristics. Cecilia presented the example of Wuhan, a city of 10 million. In the Jianghan District, they looked at key indicators — users, facilities, comfort, sound disturbance, and other metrics of public space quality.
Ayanda Roji from the City of Johannesburg discussed their development of parks as a pilot project for public space development. There is a crucial on-the-ground need to improve quality of life, a high motivation for social justice. They have made great progress in South Africa, but there are still many areas of overwhelming need. The unequal distribution of tree canopy, easily seen in remote sensing data, is an indicator of other inequalities. The most immediate challenge to get to a park is to improve the walkability of the street. We must also take into account the needs of the homeless and others. Privatization is a major problem for public space. At the same time, public space is not just empty; it needs to offer services, uses and activities. They have found that universities can be very good partners, e.g. conducting research, mapping etc. We need to ask, is there equitable distribution? Relevant data is needed to answer, and diagnosis is crucial. We must also use evidence to make the case for public space. We also need to use research to address issues of gentrification and privatization. It is not only a matter of doing research from afar — we also need to engage communities, and start a conversation.
Michael Mehaffy from KTH Centre for the Future of Places stated that, as the last speaker, he understood it would be his job to try to summarize what had been presented and invite discussion. He said he was greatly impressed by all the progress made by the other organizations represented, and the question now seemed to be how to tie all this together and move forward on a politically and practically acceptable set of indicators. He gave a brief introduction to the Future of Places partnership and its emphasis on public space as a fundamental urban network, as well as some “key messages” that emerged from the partnership, with their focus now on research into practice. He noted that the New Urban Agenda calls for knowledge-sharing and user-friendly data exchanges, of exactly the kind under discussion. Regarding the SDG 11.7.1, the remote sensing capability is very impressive, but all agreed that “ground truthing” will be required, i.e. gathering supplemental field data regarding access, barriers, proximities, adjacencies, detailed configurations, etc. This could also be supplemented with social surveys of patterns of use, exclusion, and other disaggregations of the goal. Because this could be an overwhelming task and simplicity is needed, he suggested that a statistical sampling method could be used. He concluded that the metric needs to be both technically and politically feasible, and very user-friendly. Municipalities will be the main agencies responsible for gathering the data, but could enlist many partners, e.g. universities, local NGOs etc. The resulting indicator might take the form of a single composite metric comparable to “Walkscore” with sub-metrics that are straightforward, even if the remote sensing technology uses complex data sets and big-data sources. He also suggested that perhaps the data-gathering could be a step in engaging the stakeholders and implementers, particularly if they could be engaged through an open-source platform, e.g. Open Street Maps etc.
An active discussion followed. Opposition was expressed to the idea of a “global standard” — local municipalities need to have local control, while at the same time the indicator needs to offer a baseline to be compared. One person raised the issue of public toilets as a key aspect of public space. One person stressed the importance of public space access for the elderly. The group also discussed different technology platforms, and open-source versus proprietary (official) systems. All agreed that the remote sensing as discussed has impressive capabilities, but “ground-truthing” will also be critical. The question was also raised of how built-up areas are defined, and how those relate to municipal boundaries. It will be necessary to exclude non-built-up areas, and at the same time identify municipal boundaries. These two geographic boundaries are overlapping but non-contiguous, and this needs to be recognized, since it will be up to each municipality to gather the data. Other challenges were discussed, including the problem of complexity and need for simplicity, the question of who will measure, and the political acceptability of different approaches. Another major question is how to determine actual control of spaces, e.g. ownership, leases, contractual rights, private space used by the public, public space used exclusively by private entities such as permitted restaurant seating, etc. A simplification will likely be needed!

