
In the battle against climate change, cities will be even more important than we realize. Research shows that Vehicle Miles Traveled (VMTs) are only part of the story, and should not be considered in isolation from other factors.

In the debate over climate change action, most of the attention to date has focused on cleaner energy sources, and more efficient technologies like electric cars. Surprisingly little attention has gone to one of the largest drivers of climate-changing emissions: the urban structure of our cities, towns and suburbs. There are important reasons why this is so – and why it must change.
Recent research paints a clearer picture that differences in such “urban morphology” account for major differences in emissions – in fact, much greater differences than previously thought. For example, those living in cities with average European morphological characteristics – compact, walkable, transit-served, with a good distribution of daily services – generate emissions per person of roughly half of residents of an average American city. Yet we know that Europeans do not suffer from a quality of life only half as good as residents in the US. Indeed, on many indicators their quality of life is higher.
This is a telling finding – and there is still more to the story. By combining retrofitted buildings, district-scale energy and other synergies, the reductions of emissions can be even more dramatic. (Of course, there are other significant ecological and lifestyle benefits in the European urban model as well.)
Why then is so little attention paid to this key issue?
For one thing, the form of cities changes slowly. Policy makers, tempted to look for “quick wins,” often turn to technological solutions – but those, as history shows, often don’t pan out. In fact, precisely because urban form changes slowly, its effects over time accumulate in a powerful and predictable way. The urban infrastructure being built today will be in place, and will continue to shape emissions, for decades to come. It is particularly alarming that China, India, Brazil and other rapidly growing countries are continuing to import a US-style, car-dominated model of growth: that fact alone could easily overwhelm all other efforts at reduction of emissions.
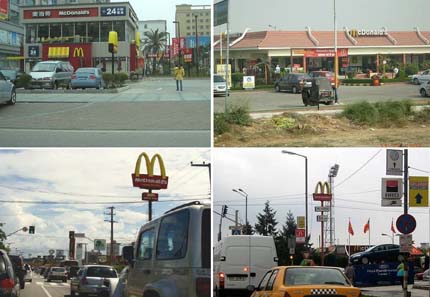
ABOVE: Drive-through McDonalds as an indicator species: recent examples of US-style car-based development in China, India, Brazil and Romania — all built within the last ten years, and much more can be expected.
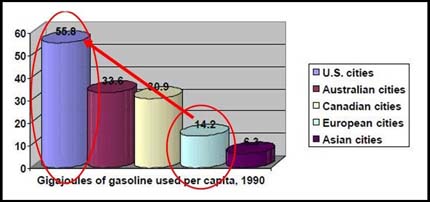
ABOVE: There is an enormous difference in energy use between compact European cities and sprawling American ones – without the same difference in quality of life. This chart shows gasoline use, but other uses follow a similar pattern. Source: Newman and Kenworthy, Sustainability and Cities.
Another reason for the scant attention is that it’s difficult to grasp all the disparate elements of urban morphology, and how they work in a system. Small factors together can create a much bigger effect than they may seem to have in isolation. By contrast, it’s tempting to hang our hopes on discrete improvements in the efficiency of technology, which are more easily understood. But as noted, sometimes these don’t pan out. Perhaps even more importantly, improvements in efficiency can be quickly erased by increases in demand.
Even many champions of urban land use as a climate change issue often focus on the relatively narrow topic of automobile travel, and so-called Vehicle Miles Traveled (VMTs). Although this is indeed an important emissions source, the research shows that it’s only the beginning of the total contribution from urban form. As a result, VMT reduction advocates miss the bigger picture, and argue over relatively modest reductions of emissions which may – or may not – be possible through a variety of strategies. This was illustrated most clearly in debate over a recent study released by the National Academy of Sciences, which looked only at emissions from “personal travel” – and was accompanied by the headline in MIT’s Technology Review, Forget Curbing Suburban Sprawl: Building denser cities would do little to reduce CO2 emissions, a new NAS report concludes.
But this is far from what the latest research really shows. This author was part of a team that presented and discussed survey research at last spring’s Scientific Congress on Climate Change in Copenhagen, a research symposium of 2,000 leading scientists hosted by the International Alliance of Research Universities. The conclusions are dramatic.
The research suggests that a change in the way we build cities can, in the coming decades, cut total emissions by one-third or more. Conversely, if we do nothing, the way we build cities and suburbs will likely continue to increase emissions – possibly dramatically, as large countries like China, India and Brazil continue to develop their cities in the coming decades, and choose whether to copy the American sprawl model, or other, much lower-carbon models of urban morphology.
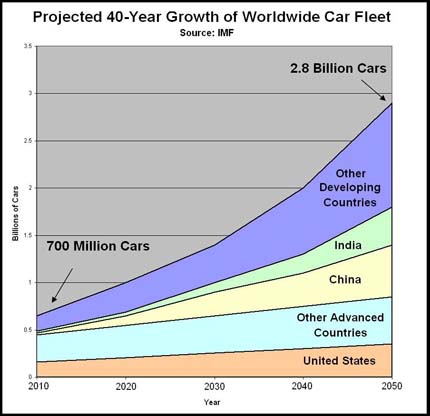
ABOVE: The International Monetary Fund has projected a four-fold increase in the global fleet of personal vehicles over the next four decades. Even if all of these vehicles are electric, it is likely that the enormous increase in energy demand will be fueled largely by coal, significantly adding to emissions.
Many authors have noted the strong correlation between urban density and emissions per person – particularly when it comes to the role of personal travel by automobile. But density, like automobile travel, is only the start of the story, and we need to tease out the other factors “packed in” to density, and how they operate together within urban systems.
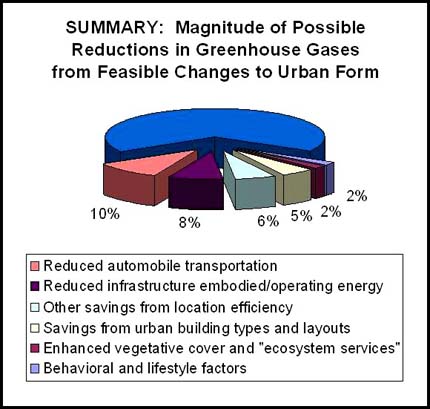
In addition to the effects of personal travel by automobile, our research identified significant sources of emissions from urban form in five key categories: infrastructure, and its embodied and operating energy; other advantages of “location efficiency,” including additional benefits of walking; optimized size, orientation and urban shaping of buildings; lost ecosystem services; and behavioral factors and “induced demand.” Taken together, these factors account for an amount equal to or more than (and up to twice as much as) the emissions from personal transportation and VMTs alone. This is a compelling finding, warranting more research – and much more awareness and action among policy-makers.
Infrastructure, Embodied and Operating Energy
As noted, tailpipe emissions from VMT are only the beginning of the story. To that we must add the emissions from the construction of the vehicles; the embodied energy of streets, bridges and other infrastructure; the operation and repair of this infrastructure; the maintenance and repair of the vehicles; the energy of refining fuel; and the energy of transporting it, together with the pipes, trucks and other infrastructure that is required to do so.
Research indicates this is another roughly 50% again of energy and emissions over tailpipe emissions – and much of it occurs regardless of VMT. It is, however, very sensitive to urban morphology: it is greatly affected by the amount of infrastructure per person, the need to have cars available when other options are not available, the need to build and maintain more shops and service stations for an auto-dependent transportation system, and so on.
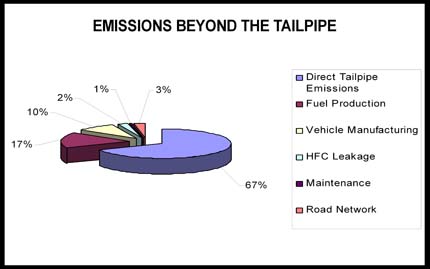
ABOVE: Tailpipe emissions from driving are only the start of the energy and emissions related to urban form. Just the infrastructure needed to supply and accommodate a fleet of vehicles, regardless of how many miles driven, is significant. Source: Hydroquebec.com.
Moreover, to the factors above we must add other significant contributions: the embodied energy and repair of other infrastructure, such as water, sewer and gas pipes, wires and so on; the energy required to pump or otherwise operate them; the significant “transmission loss” of energy to more dispersed users; the very high efficiency possible in district-scale energy – particularly when it captures waste energy; and the ability to capture other efficiencies of co-location, such as waste heat from sewage.
Location Efficiency
Another significant area is so-called “location efficiency,” or optimal distribution of the various destinations within a city – jobs, shopping, schools, recreation and so on. As many advocates note, this helps in reducing Vehicle Miles Traveled — but here again, that’s only the beginning of the story. Location efficiency also reduces the need for long travel on public transit, and it increases the efficiency in the public transit system itself. It can also facilitate walking, bicycling and other modes that have additional positive effects.
The Urban Shaping of Buildings
In urban studies, we quickly learn that no building is an island. Buildings respond to the structure and density of their neighborhoods, and their complex mix of proximities, market dynamics and other factors. Among the urban factors we must consider: prevailing housing type and size; adjacencies with other units (e.g. common walls and floors that reduce heat loss); efficiencies of exposure and shelter, from sun, shade, wind etc; efficiency of private outdoor space: large yards versus compact ones, or other small outdoor spaces, and the resources they require for maintenance; and ability to support a walkable streetscape. Many building types, notably those that orient parking toward the street, are not conducive to a walkable public realm.
Lost Ecosystem Services
Another important area that has only recently begun to come into focus is what is known as “ecosystem services.” The more we achieve compact growth, leaving existing areas of vegetative cover, wetland, permeable ground and so on, the more we can leave intact ecosystems that perform potentially costly services to clean our water, air and soil. The factors here include vegetative cover per person (the amount of area left, or re-grown, which helps to clean the air and remove CO2); infiltration zones that allow water to be cleaned and purified as it re-enters the ground, or passes through wetlands; and albedo effects – that is, the ability of surfaces to reflect solar energy back into space, or in the case of plants, to convert it to use in the breakdown of CO2.
Behavioral Factors and “Induced Demand”
Perhaps the most poorly understood area, and yet what may prove to be the most important, is that of growth in demand for the consumption of resources, and related behavioral effects. “Induced demand” is the tendency to use up additional efficiencies of the urban system (e.g. to drive more, use more drive-through facilities, fill up new roads, etc).
There is intriguing evidence that urban and building morphology shape individual consumption patterns, and thus demand, in important ways. For example, evidence suggests that a large suburban house that affords few nearby outdoor activities, may encourage more energy-consuming indoor activities, and potentially more consumption of relatively disposable goods.
Conversely, evidence suggests that a more compact neighborhood, offering walkable streets, inviting public spaces, recreation areas, and a mix of daily amenities and needs, does promote much more walking, social interaction and other low-carbon activities. (It also offers significant health benefits, and other long-term benefits.)
We suggest that this important topic requires more careful research. Although it is a thorny area — as human and behavioral sciences often are — we need not fear any behavioral determinism. The built environment merely defines the scope of options available to citizens, so that they can choose more desirable options for themselves — and for society as a whole, through democratic decision-making about the shape of the common realm.
We see this principle working very well in empirical examples of the most desirable neighborhoods – we already mentioned Europe, but there are other equally good examples in the United States, and many other countries as well. On a comparable, income-adjusted basis, research suggests that for the citizens of Paris or London or San Francisco or Vancouver or many other vibrant urban places – places where people freely choose to live, and often pay handsomely to do so – the carbon footprint per person, and the ecological footprint in general, are dramatically lower.
On the other hand, sprawling, high-carbon suburbs do not appear by miracle, or by virtue of pure consumer choice in a vacuum: they have been no less consciously planned, and they continue to exist through a powerful system of economic and regulatory incentives and disincentives. They also effectively push off real costs into the future, when our children and grandchildren will be forced to pay for increasingly alarming environmental costs like climate change – not to mention for costly and inefficient infrastructure, and for the broader consequences of unsustainable housing economics.
In this respect, the current global financial crisis – which originated in the sprawling suburbs of the US – may be seen as a harbinger of the likely devastating economic consequences of continued “business as usual”. By contrast, new research is pointing the way to promising – and feasible – reforms of the “operating system” of urban growth and change.
 ABOVE, higher density strongly correlates with lower emissions, as this striking illustration of total emissions by household demonstrates. The lower emissions of central San Francisco (in green) correlates with higher density in yellow), whereas in the East Bay neighborhood near Hayward, higher emissions (in red) correlates closely with lower density (in blue). Source: ESRI https://www.arcgis.com/apps/MapSeries/index.html?appid=94b9eff6547f459fba27a6853327e1a2

However, it’s important to understand that it’s not just density that varies, but also urban form, including walkable mixed use. In these two areas, climate, government, income and other factors are all comparable – and reveal that dramatic differences in urban form produce dramatic differences in carbon emissions. ABOVE, this newer Bay Area neighborhood has a very different urban form from its San Francisco counterpart (below). Not only is it lower density, but its street pattern is sprawling, and it is functionally segregated, car-dependent, and lacking in walkable public space. By comparison, the San Francisco neighborhood (BELOW) is a tight walkable grid with regular transit, a mix of uses, and relatively compact homes.

Conclusion
It must be acknowledged that in the fight against climate change, we will certainly need new, cleaner forms of energy, and much more efficient technology. But we will need more than that. As the compelling research shows, it is in our cities, towns and suburbs that the vast majority of the demand for the world’s resources originates — and in turn, the vast majority of the emissions that cause climate change. These places cannot force people to live a more elegant, satisfying, low-carbon way of life. But they can make it possible – or, as is far too much the case now, they can make it improbable, or even impossible.
Our job as professionals and citizens, surely, is to make it possible, and moreover, desirable – working in concert with policy experts and researchers to understand better, and to act on, the growing body of evidence discussed here. That research begins to show us how we can build a world of far more efficient, lower-carbon urbanism – which is, at the same time, more livable and beautiful. As the clear findings from the world’s top researchers demonstrate, very much is riding on it.
This post also appeared on Planetizen.com at https://www.planetizen.com/node/41801. We are grateful to the Planetizen editors.
